MRI Processing
Processing pipeline
The processing of 3DT1, DWI and ihMT images involves several pipelines developed by SCIL using Nextflow tools. The main steps of the processing are summarized in the figure and describe below.
The main steps are:
- Generate tractograms and maps
Tractoflow is used to process T1 and DWI images to generate tractograms and diffusion measurement maps derived from the DTI model and fODF. Tractoflow outputs are then used as input for the Freewater Flow to correct DWI and generate Freewater-corrected DTI model-derived measurement maps and the Freewater map. Similarly, the NODDI Flow is used to generate four microstructure maps computed using the Amico model. In parallel, ihMT images are processed with the ihMT Flow to generate the four myelin maps (2 ratios and 2 saturations, i.e. corrected for T1 dependence, Figure 1).
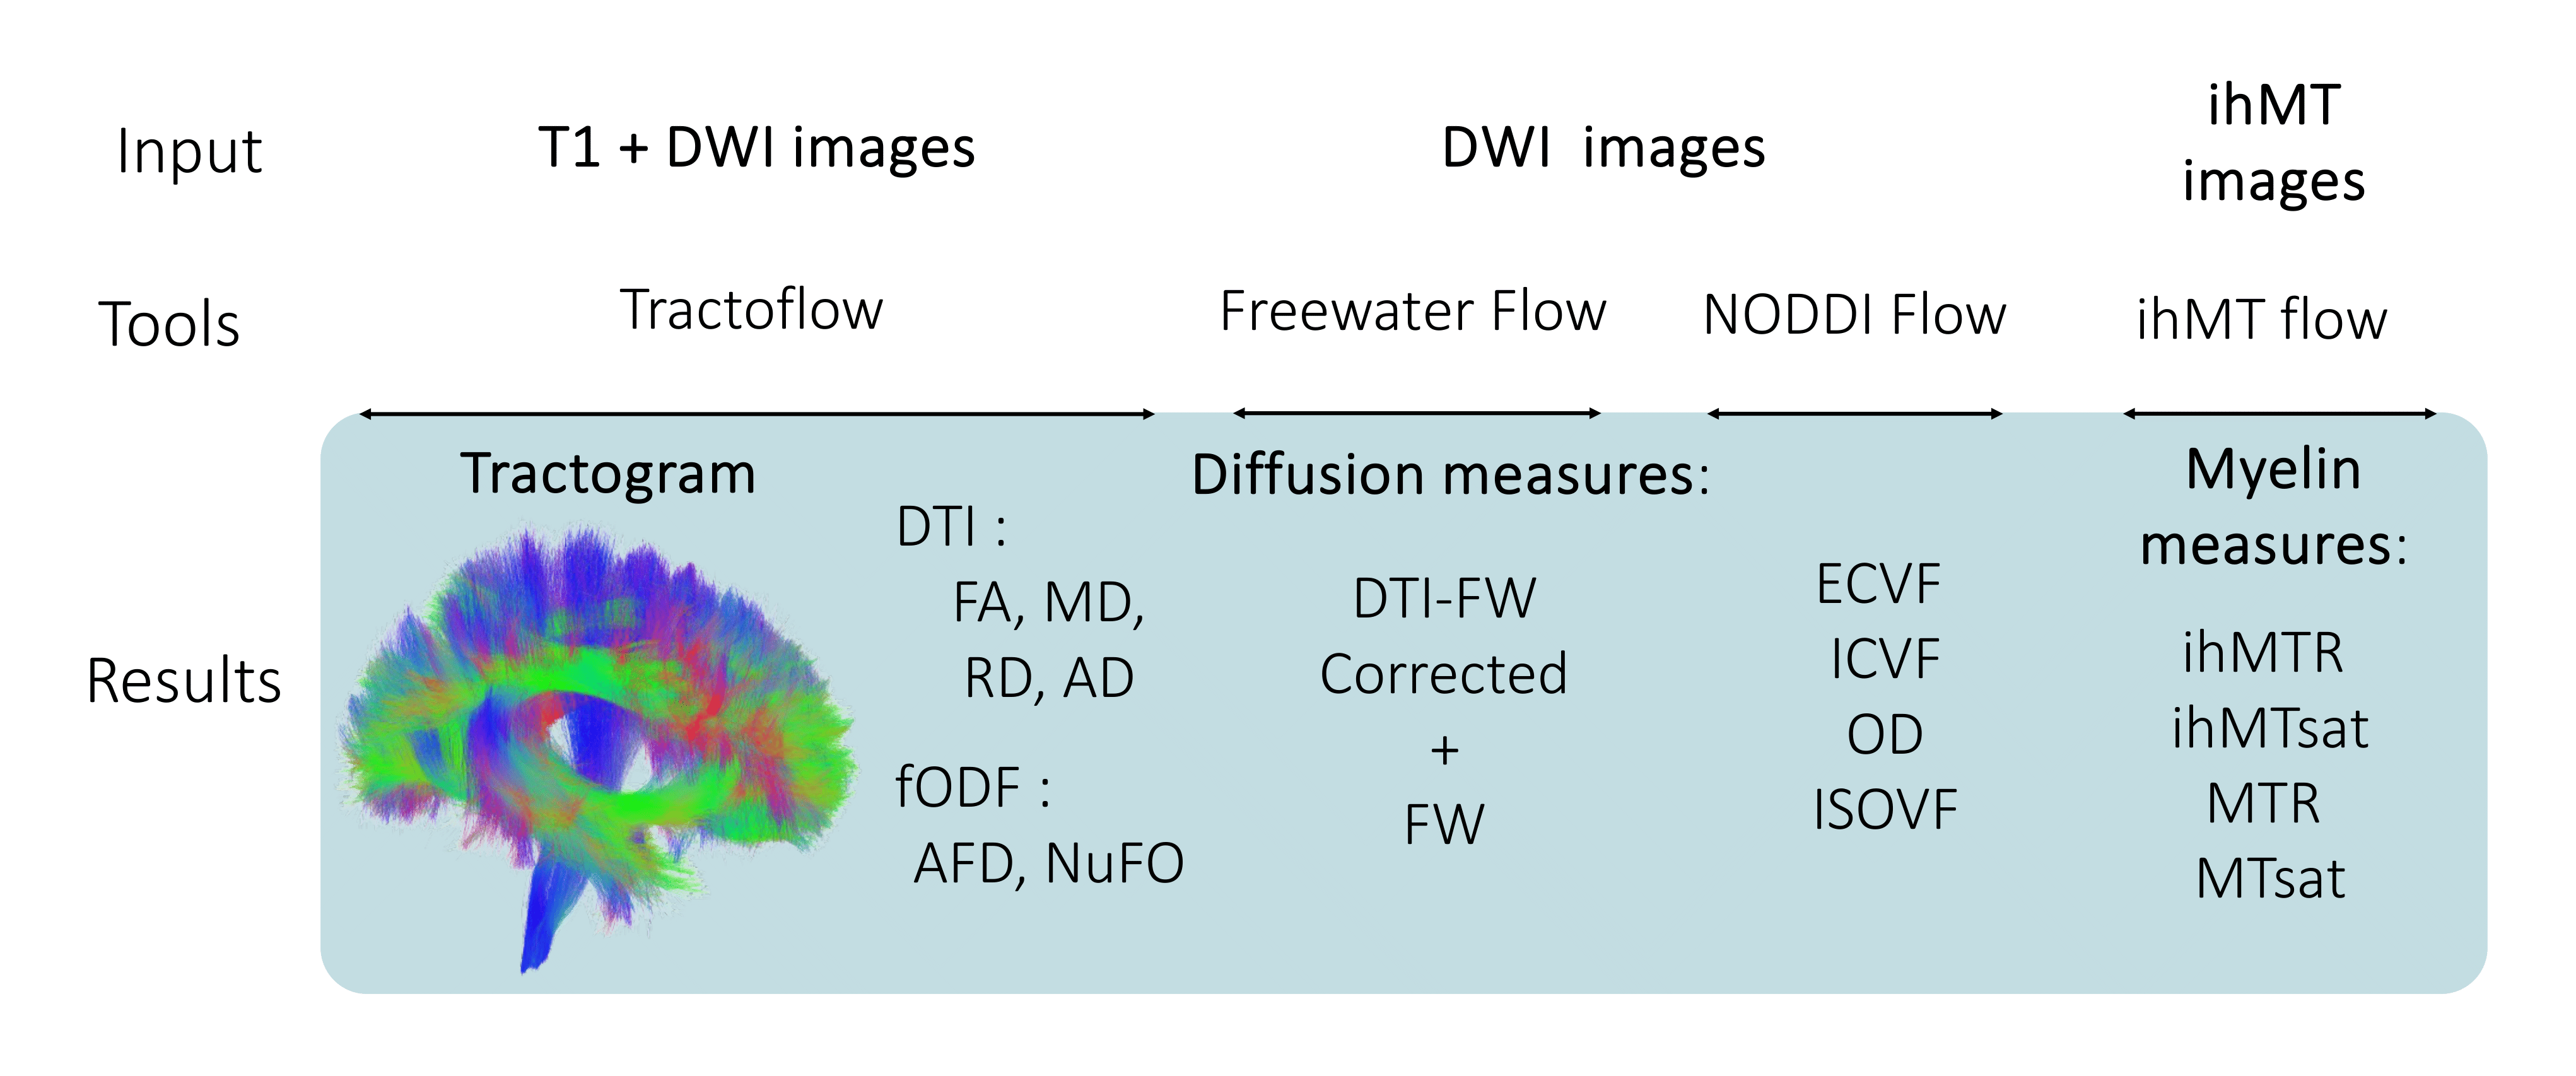
Figure 1. Image processing using different flows to generate tractograms and diffusion and myeline maps.
- Bundles segmentation
From the tractogram generated by Tractoflow, the major white matter bundles are segmented using RecobundlesX Flow (RBX, Figure 2).
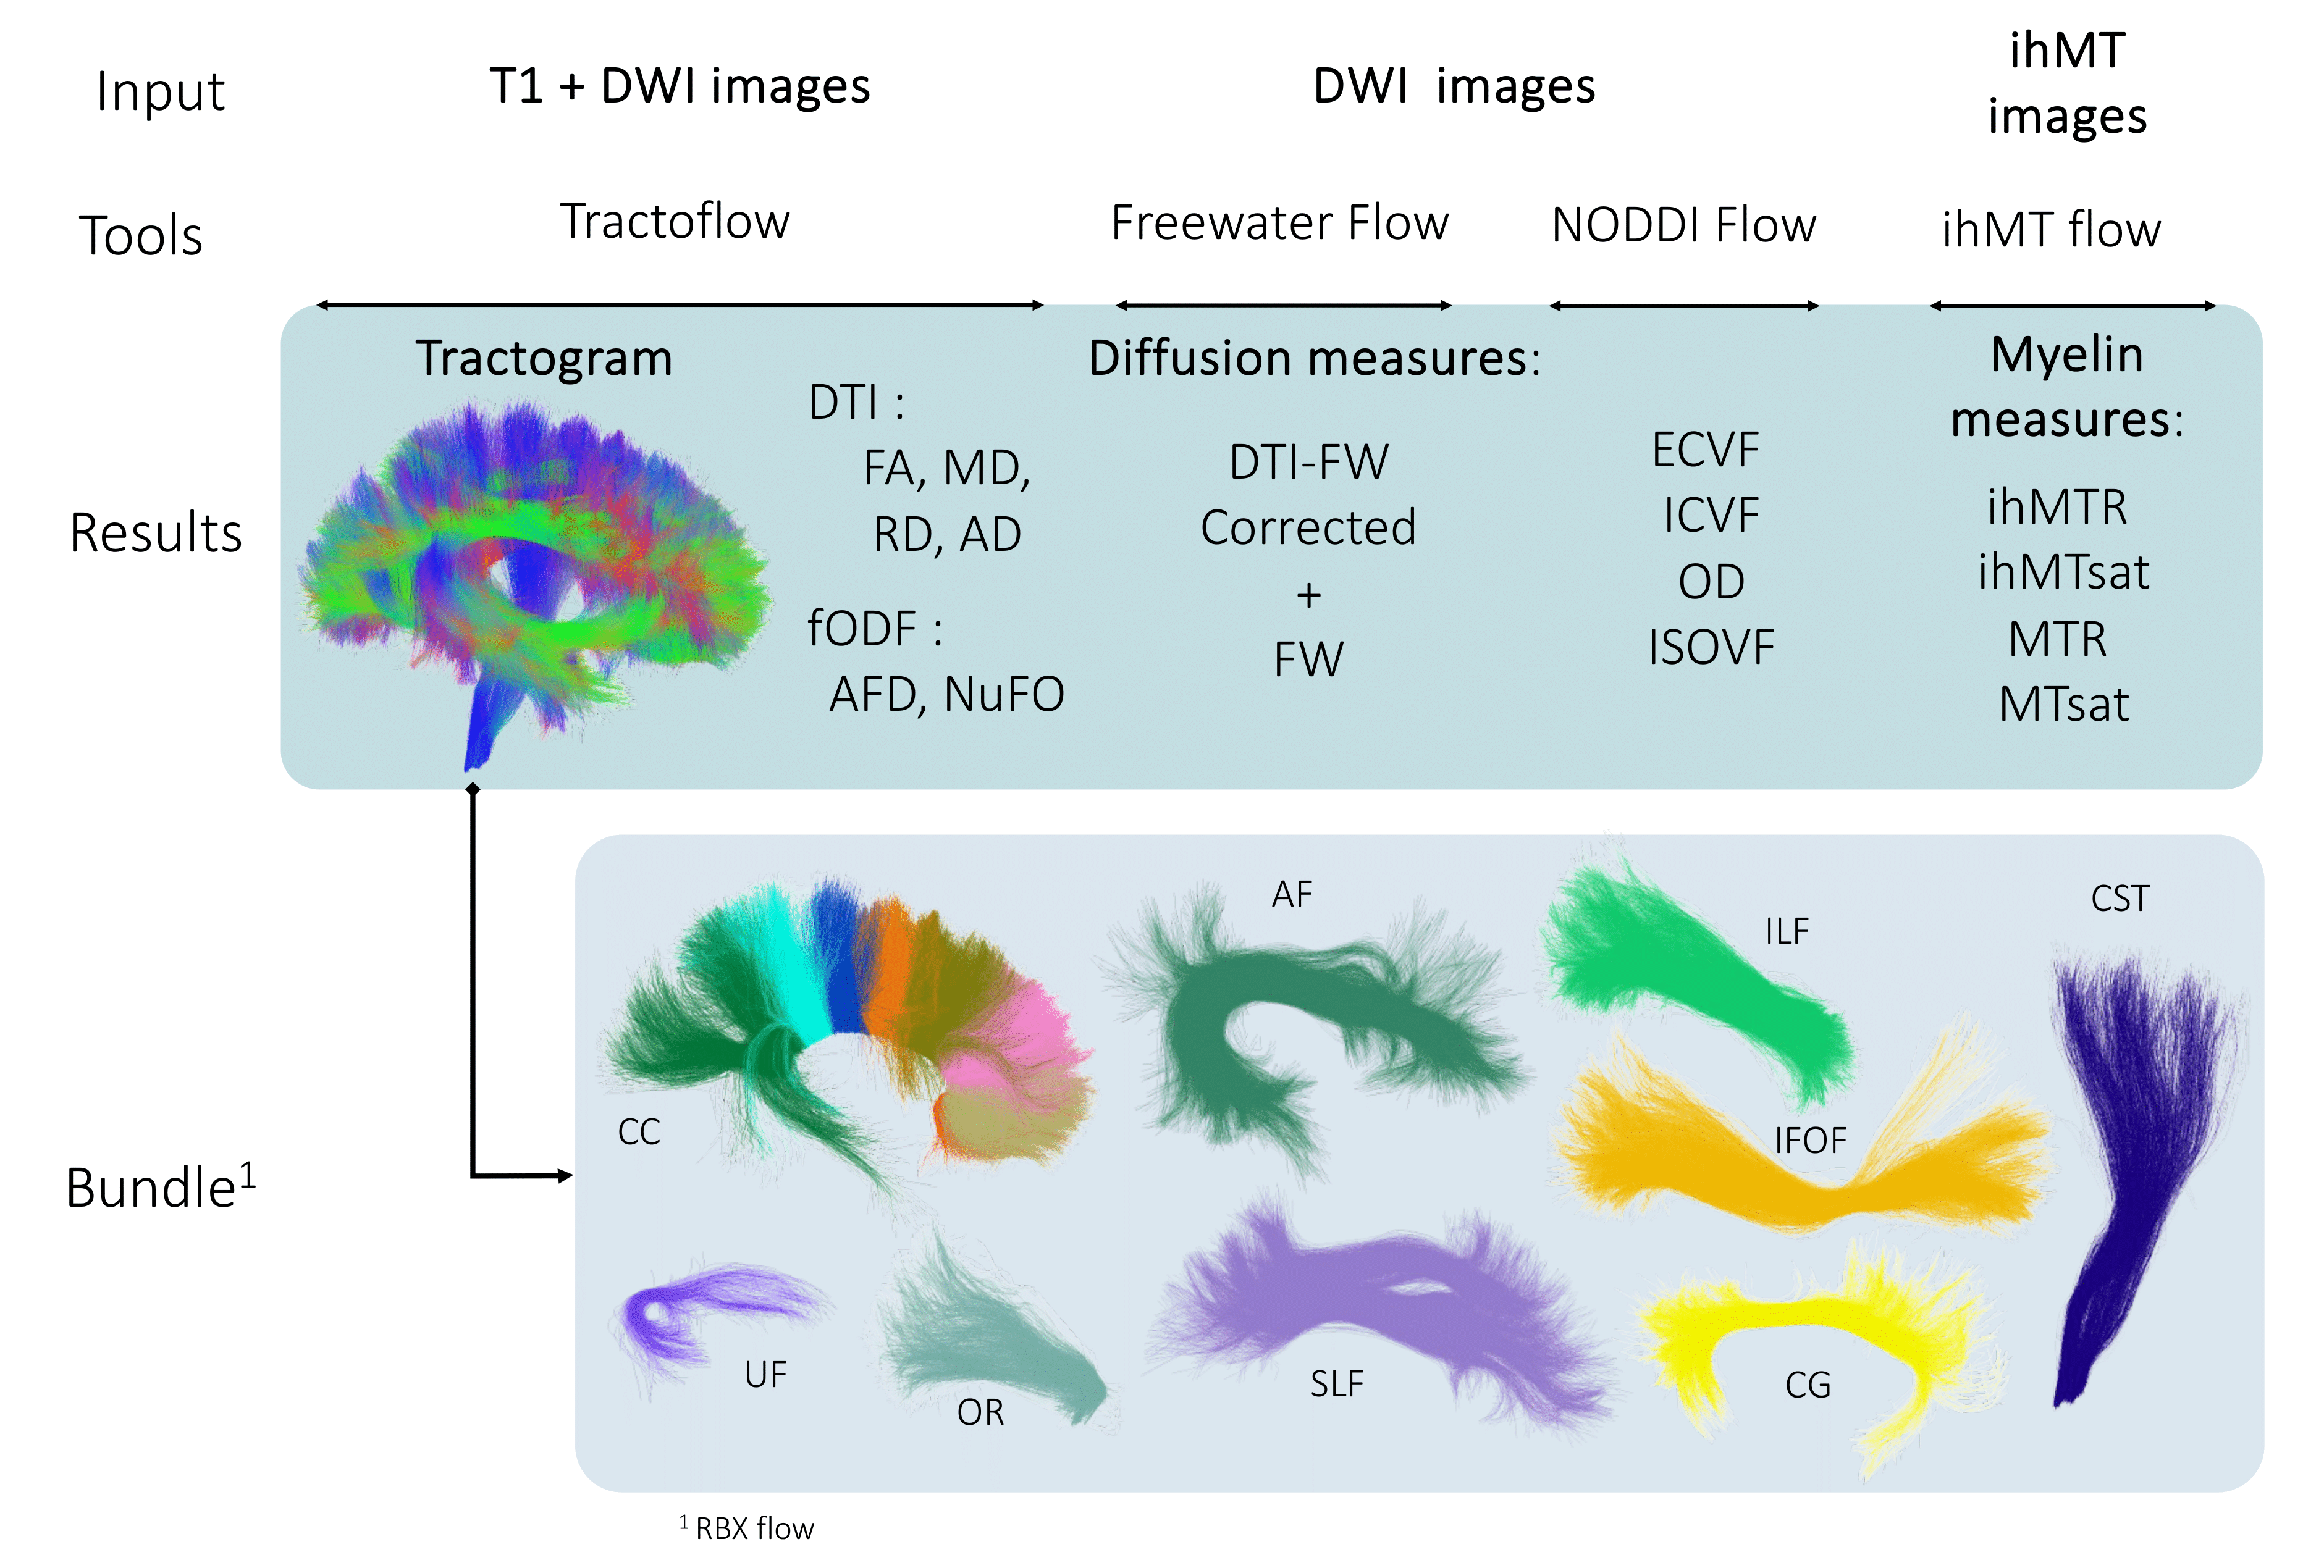
Figure 2. Segmentation of the major white matter bundles from the tractogram generated by Tractoflow.
- Extract average measurements
Finally, from each bundle and the measure maps, the mean value for the whole bundle and along the bundle is obtained using Tractometry Flow (Figure 3).
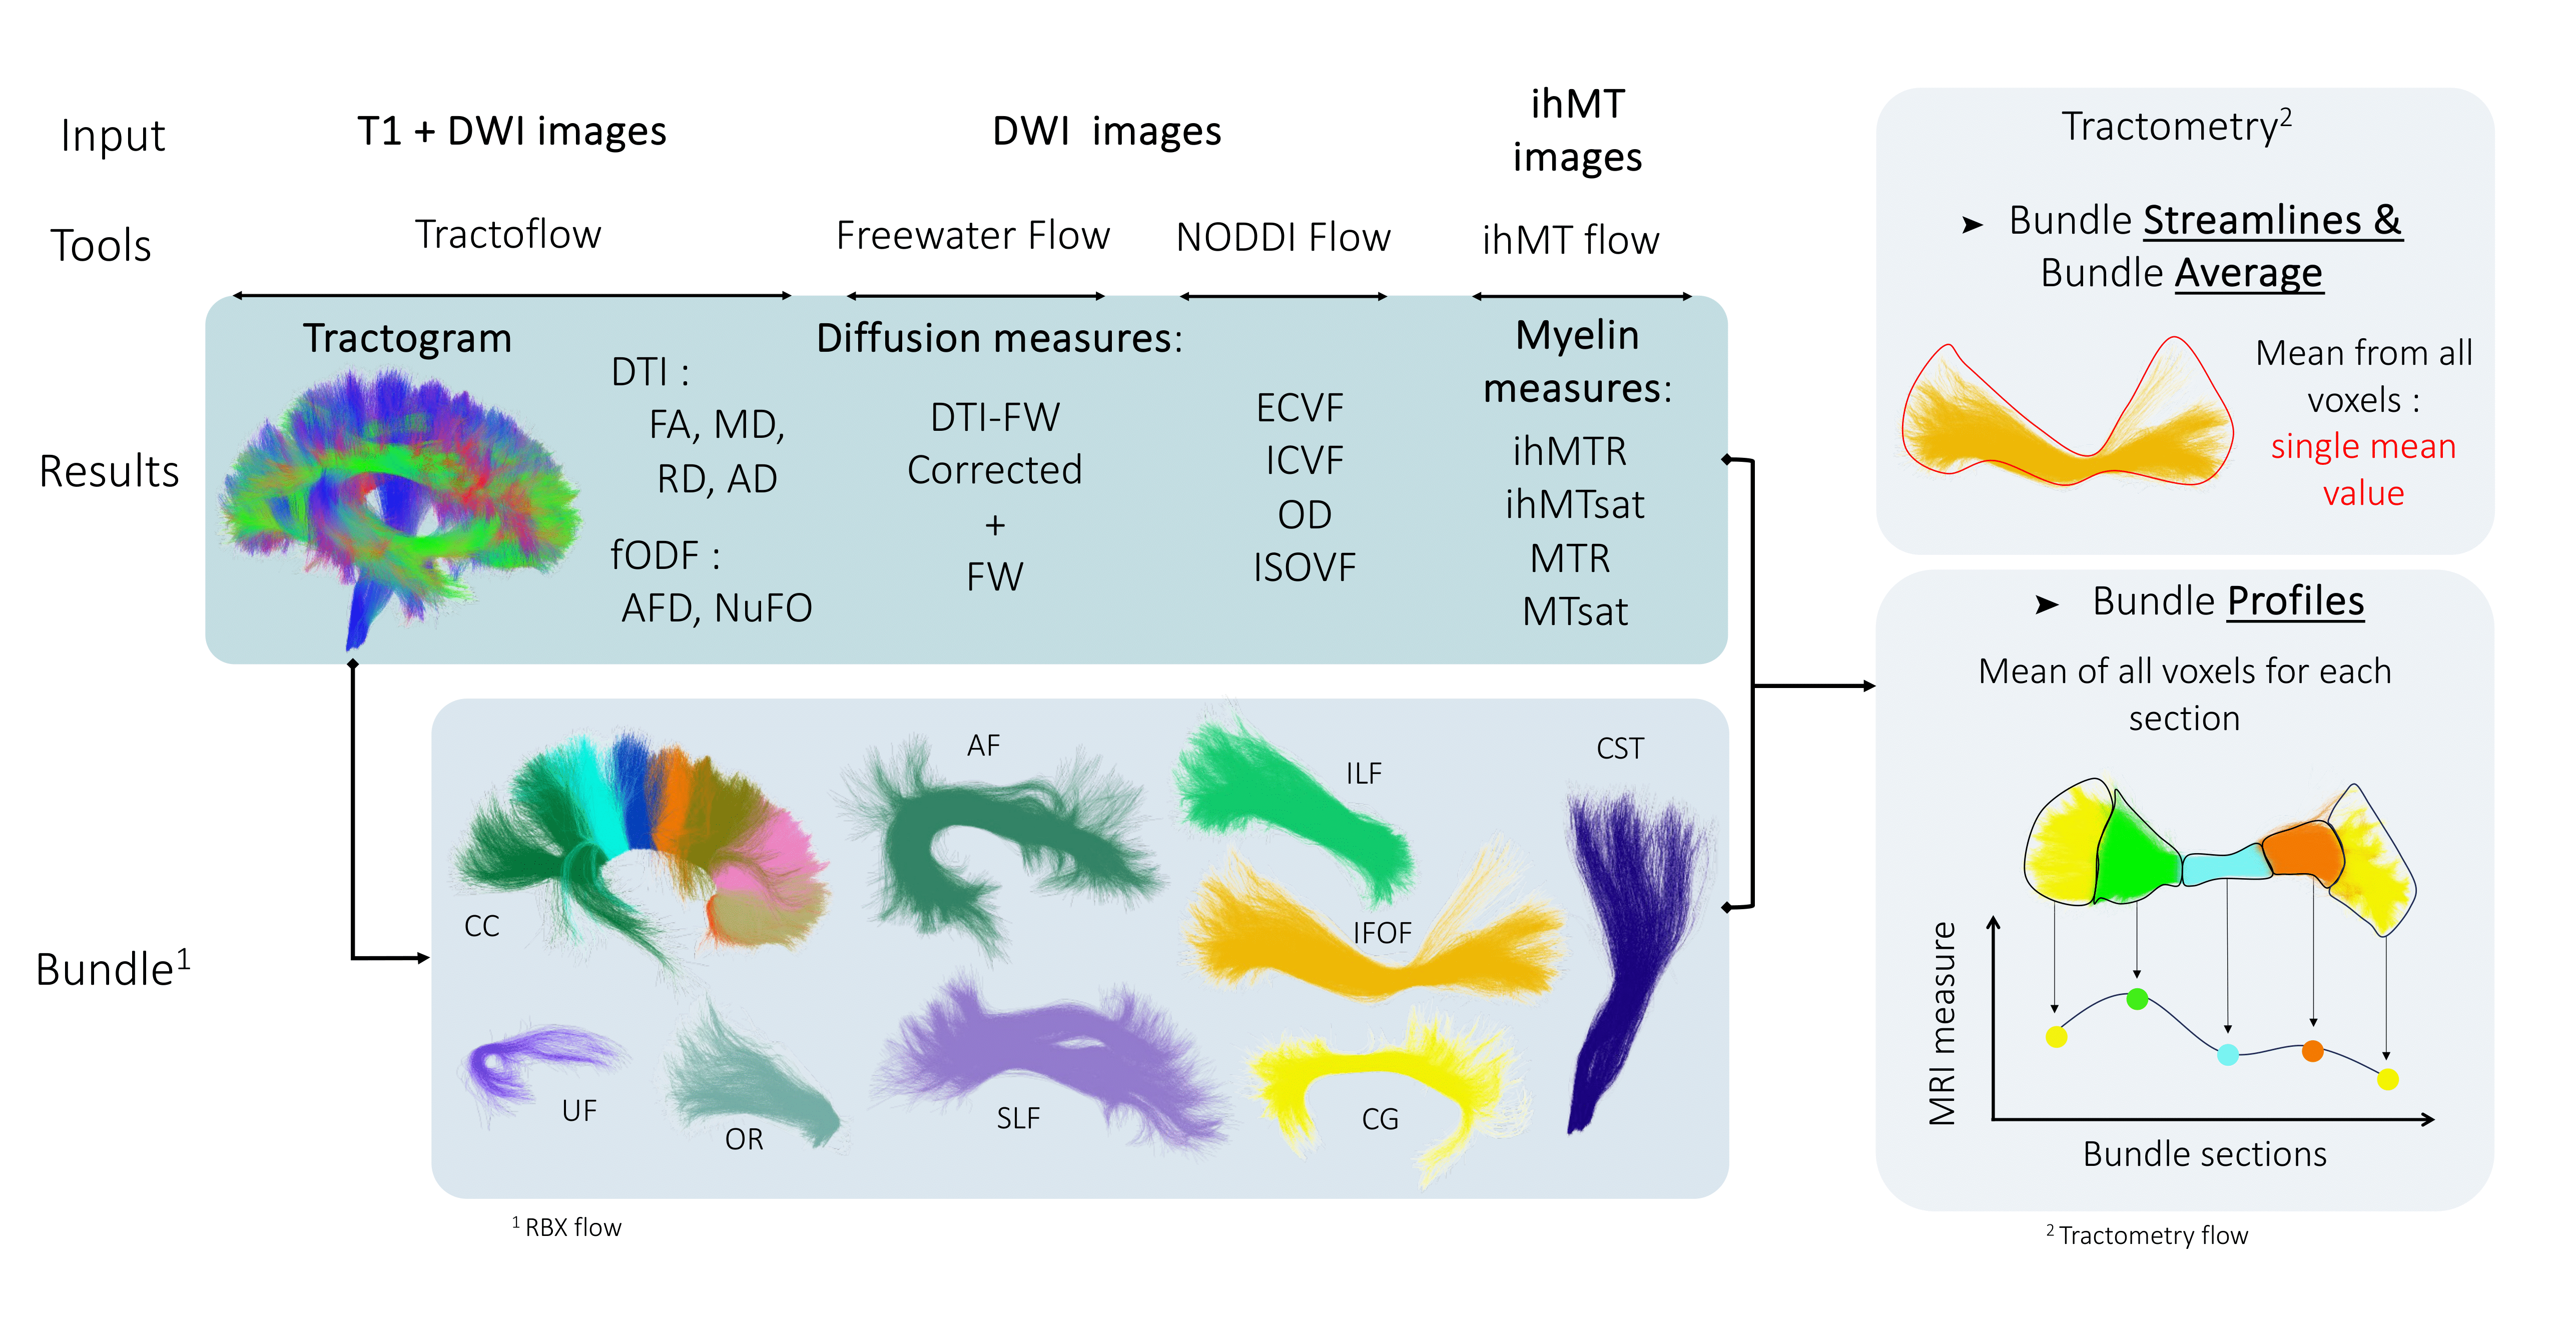
Figure 3. Extraction of multiple measurements using the combination of segmented white matter main beams and MRI measurement maps.
Segmented bundles
Representation of the major white matter bundle models used by RecobundlesX Flow (RBX) as shape priors to extract the bundles from the whole tractogram. Bundles of both hemispheres are shown.
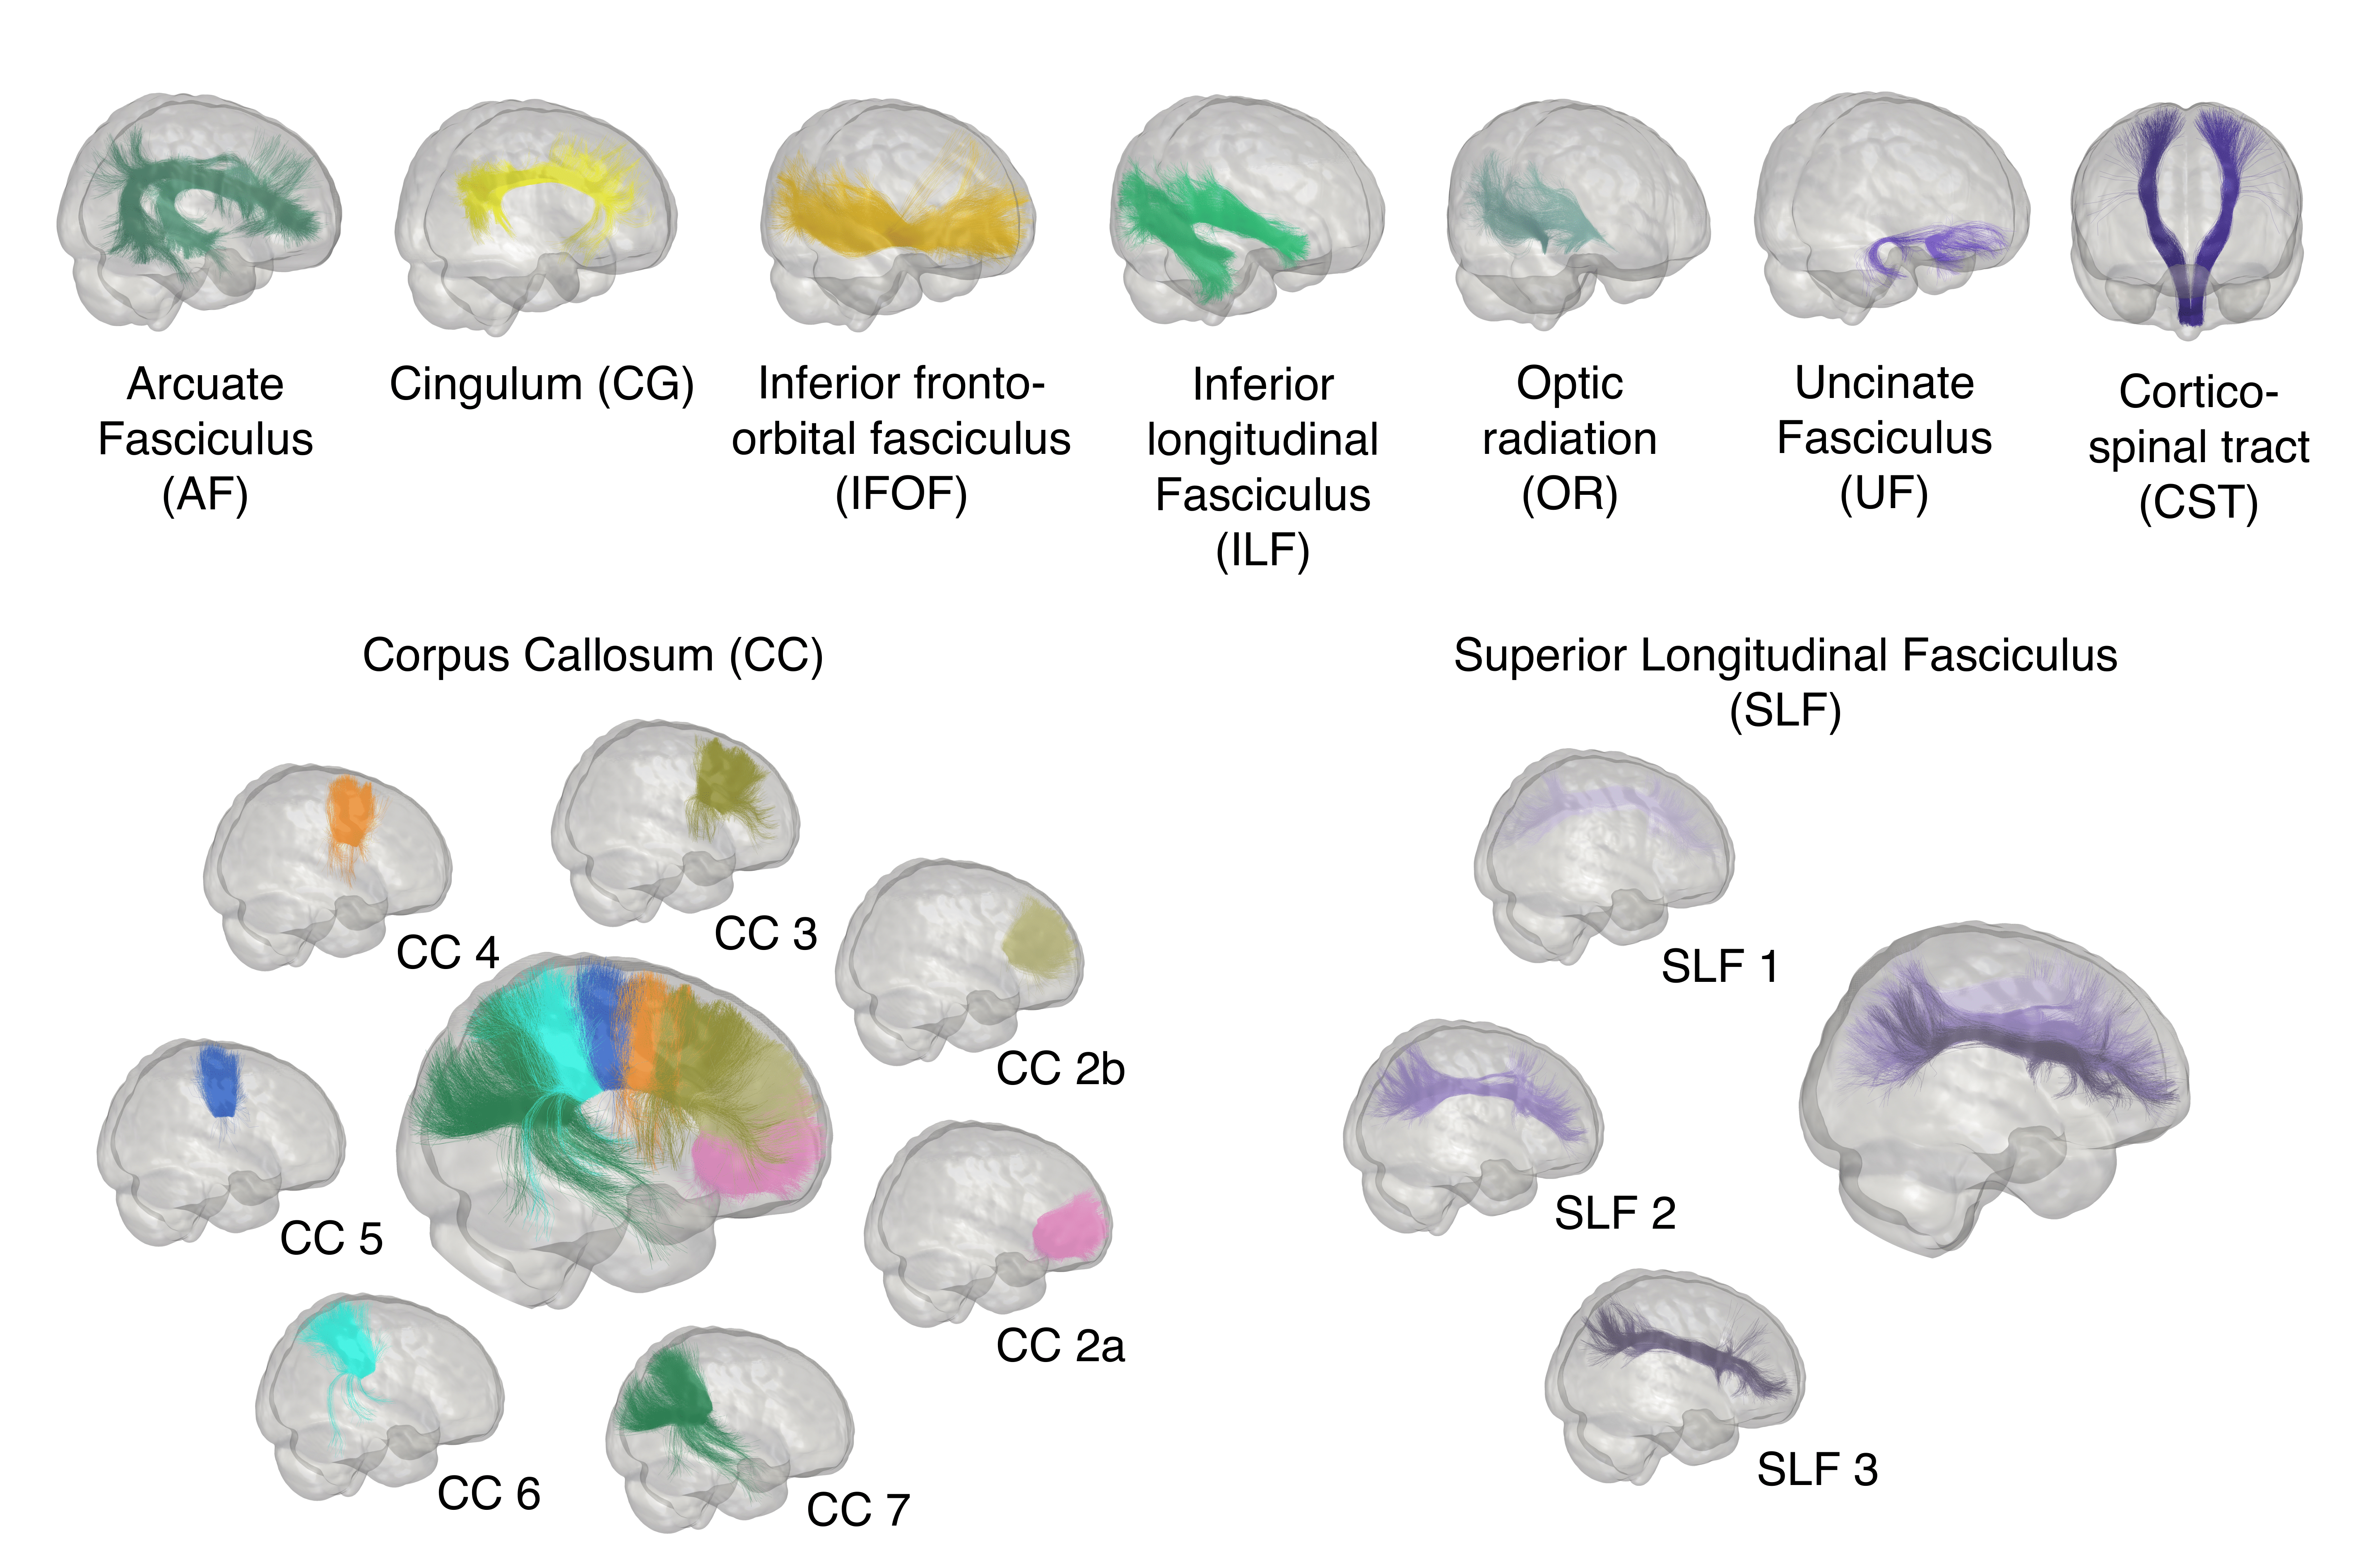
The Arcuate fasciculus is in dark green, the cingulum in yellow, the inferior fronto-orbital fasciculus in orange, the inferior fronto-occipital fasciculus in ligh green, the optic radiation in blue-green, the uncinate fasciculus in dark purple, the corticospinal tract in dark blue, the superior longitudinal fasciculus parts in purple gradation, the corpus callosum is represented in several color ranges.
Quality Control
The visual quality assessment procedure was applied to the main steps according to the following criteria (using DMRI QC Flow):
MRI images |
Step |
Exclusion criteria |
|---|---|---|
T1, MTI, DWI |
Raw data |
Presence of artifacts that cannot be corrected, incorrect field of view, incorrect distribution of gradients. Noise too high in the images, high inhomogeneity (MTI), broken image, missing part of the brain (T1, MTI) |
T1, MTI, DWI |
Brain extraction |
Eyes included in the brain mask, exclusion of a part of the brain, inclusion of a large part of the background in the brain mask |
DWI |
Motion correction |
Alteration of bvecs, remaining motion in the DWI, presence of slice drop (at least in one direction) |
DWI |
RGB |
Invalid orientation in major WM structures, low FA value in expected structure (Corpus callosum for example), global color bias (indicating remaining motion) |
T1, MTI, DWI |
Registration |
Poor overlap between warped images and reference image |
T1, DWI |
Mask |
Presence of holes in mask, some part of mask missing |
DWI |
Bundle segmentation |
Unexpected shape, ends of bundle not in expected locations and/or without expected fanning, a low number of streamlines |
DWI |
Tract-profile |
Unexpected number of sections, unbalanced sections |
MTI, DWI |
Metrics map |
Unexpected range of value (FA > 1 for example), unexpected range of value in expected structure (low FA value in corpus callosum for example) |